- Data & Statistics
Access Quick Stats (searchable database)
The Quick Stats Database is the most comprehensive tool for accessing agricultural data published by NASS. It allows you to customize your query by commodity, location, or time period.
Access Quick Stats Lite
Quick Stats Lite provides a more structured approach to get commonly requested statistics from our online database.
Explore Statistics
County Level Information
Geospatial Data & Interactive Maps
- Publications
Browse NASS Reports
- by Subject
- by Date (Reports Calendar)
- by Title/Release Day
- by Keyword
- Guide to Products and Services
Additional Reports
Historical Publications
- Archived Ag Census Reports (2002 and prior - published every 5 years)
- Annual Agricultural Statistics
- Statistical Bulletins (final estimates, 1987 to 2012
- Track Records: (crops, livestock, grain stocks)
- Trends 20th century
- Price Reactions (after crop or livestock reports)
Receive Reports by Email:
- Newsroom
News Releases
04/24/25 USDA releases Census of Agriculture data results for American Samoa, Guam
04/08/25 USDA to Host Data Users’ Meeting on Statistical Programs
03/31/25 US farmers expect to plant more corn and less soybean acres
03/27/25 United States hog inventory down slightly
03/27/25 USDA releases Census of Agriculture data for the U.S. Virgin Islands
Read More News
ASB Notices
03/19/25 NASS reinstates select data collection programs and reports
02/26/25 NASS Delays Trout Production Data Release
01/02/25 NASS Delays Weekly Slaughter Release
09/25/24 NASS to publish 2023 Irrigation and Water Management report earlier
07/31/24 NASS to Review Acreage Data
Read More Notices
Videos
02/13/24 2022 Census of Agriculture Data Highlights
02/13/24 How to Find 2022 Census of Agriculture Data
02/13/24 2022 Census of Agriculture Data Release Event
07/16/21 What is a Farm?
08/05/20 The NASS Mission: We do it for you
View More Videos
ASB Briefings
04/17/25 National Hemp (April 2025)
04/10/25 Crop Production (April 2025)
03/31/25 Grain Stocks, Prospective Plantings, Rice Stocks (March 2025)
03/27/25 Quarterly Hogs and Pigs (March 2025)
03/11/25 Crop Production (March 2025)
View More Briefings
- Surveys
- Census
- About NASS
Structure and Organization
- Agency Overview
- NASS Biographies
- Organizational Chart
- Assistance to Other Organizations
- International Programs
- Talking About NASS - A guide for partners and stakeholders
- NASS Strategic Plan for FY 2022-2026
- USDA Strategic Goals
Guiding Principles
- Mission and Core Values
- Keeping Data Safe
- Confidentiality Pledge
- Security Pledge
- Security Statement
- Statement of Commitment to Scientific Integrity
- Regulations Guiding NASS
- Information Quality
- Learning Agenda, Fiscal Year 2024 -2026
Civil Rights
Work at NASS
Education and Outreach
- Understanding Ag Statistics
- Data Users' Meetings
- Morris Hansen Lecture
- International Conference on Agricultural Statistics
History and Procedures
- Agricultural Statistics Board and Lockup
- Agricultural Statistics: A Historical Timeline
- The Story of U.S. Agricultural Estimates
- As We Recall: The Growth of Agricultural Estimates, 1933-1961
-
Safeguarding America's Agricultural Statistics Report and Video
- History of Ag Statistics
- Report Procedures
- An Evolving Statistical Service
- Fact Finders for Agriculture
- Hall of Fame
- Contact Us
Mailing Address:
USDA-NASS
1400 Independence Ave., SW
Washington, DC 20250Survey FAQs and Contact Us:
Access FAQs or submit a question.
Data Inquiries:
Hours: 8:00 a.m. - 5:00 p.m. Central Standard Time
Monday - Friday, except federal holidays
Toll-Free: (800) 727-9540Media Inquiries:
Other USDA Inquiries:
Hours: Monday to Friday 8 a.m. - 5 p.m. EST
Toll-Free: (833) One-USDA
Email: askusda@usda.gov
Website: https://ask.usda.gov/s/Translation Services:
Regional and State Field Offices:
Find contact information for Regional and State Field Offices
Ask a Specialist:
Have a specific question for one of our subject experts? Contact a specialist.
Web Content Publishing Schedule:
Section 207(f)(2) of the E-Government Act of 2002 requires federal agencies to develop an inventory of information to be published on their Web sites, establish a schedule for publishing information, make those schedules available for public comment, and post the schedules and priorities on the Web site.
- Help
Technical Issues
Prospective Plantings Report Highlights
(based on March 2018 report)
2018 Soybean Planted Area
(000) acres and change from 2017
Soybean planted area for 2018 is expected to total 89.0 million acres, down 1 percent from 2017. Planted acreage intentions are down or unchanged in 20 of the 31 estimating states compared with last year.
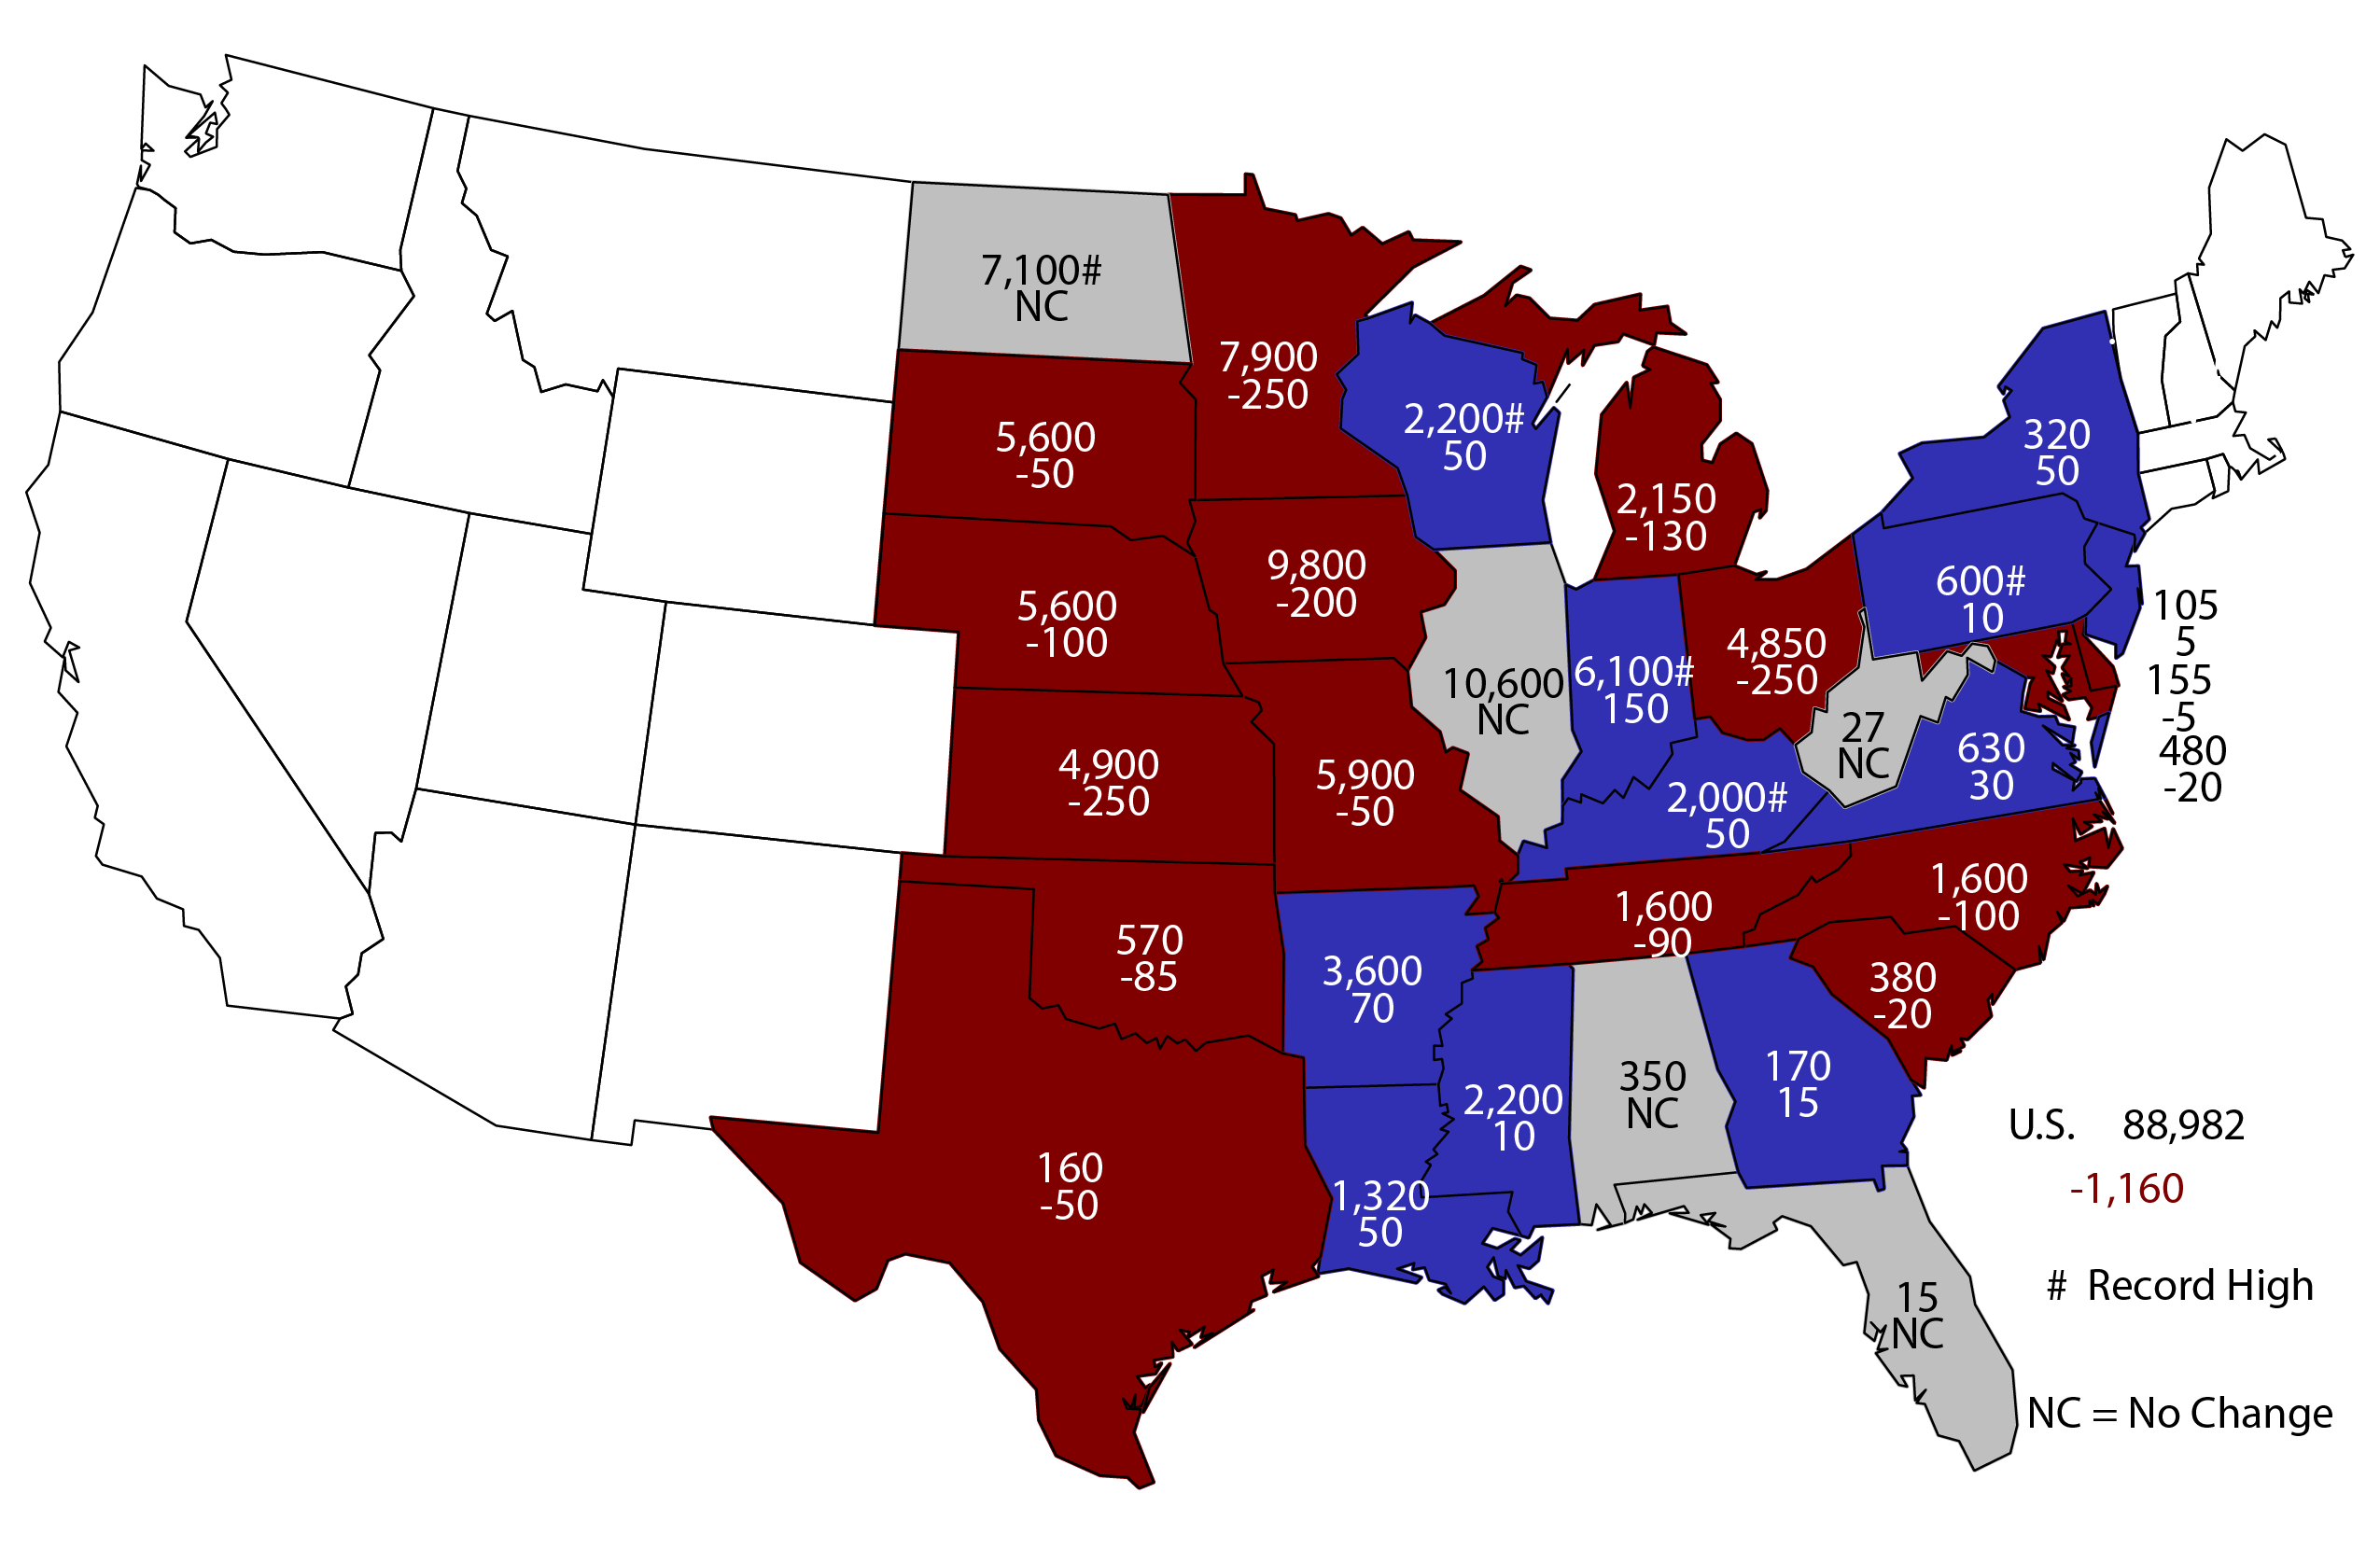
- Red = acres planted decrease
- Blue = acres planted increase
- Grey = no change in acres planted
- White = not estimated
- Top number = acres planted
- Bottom number = acres planted increase or decrease from 2017
- Red = acres planted decrease
- Blue = acres planted increase
- Grey = no change in acres planted
- Top number = acres planted
- Bottom number = acres planted increase or decrease from 2017
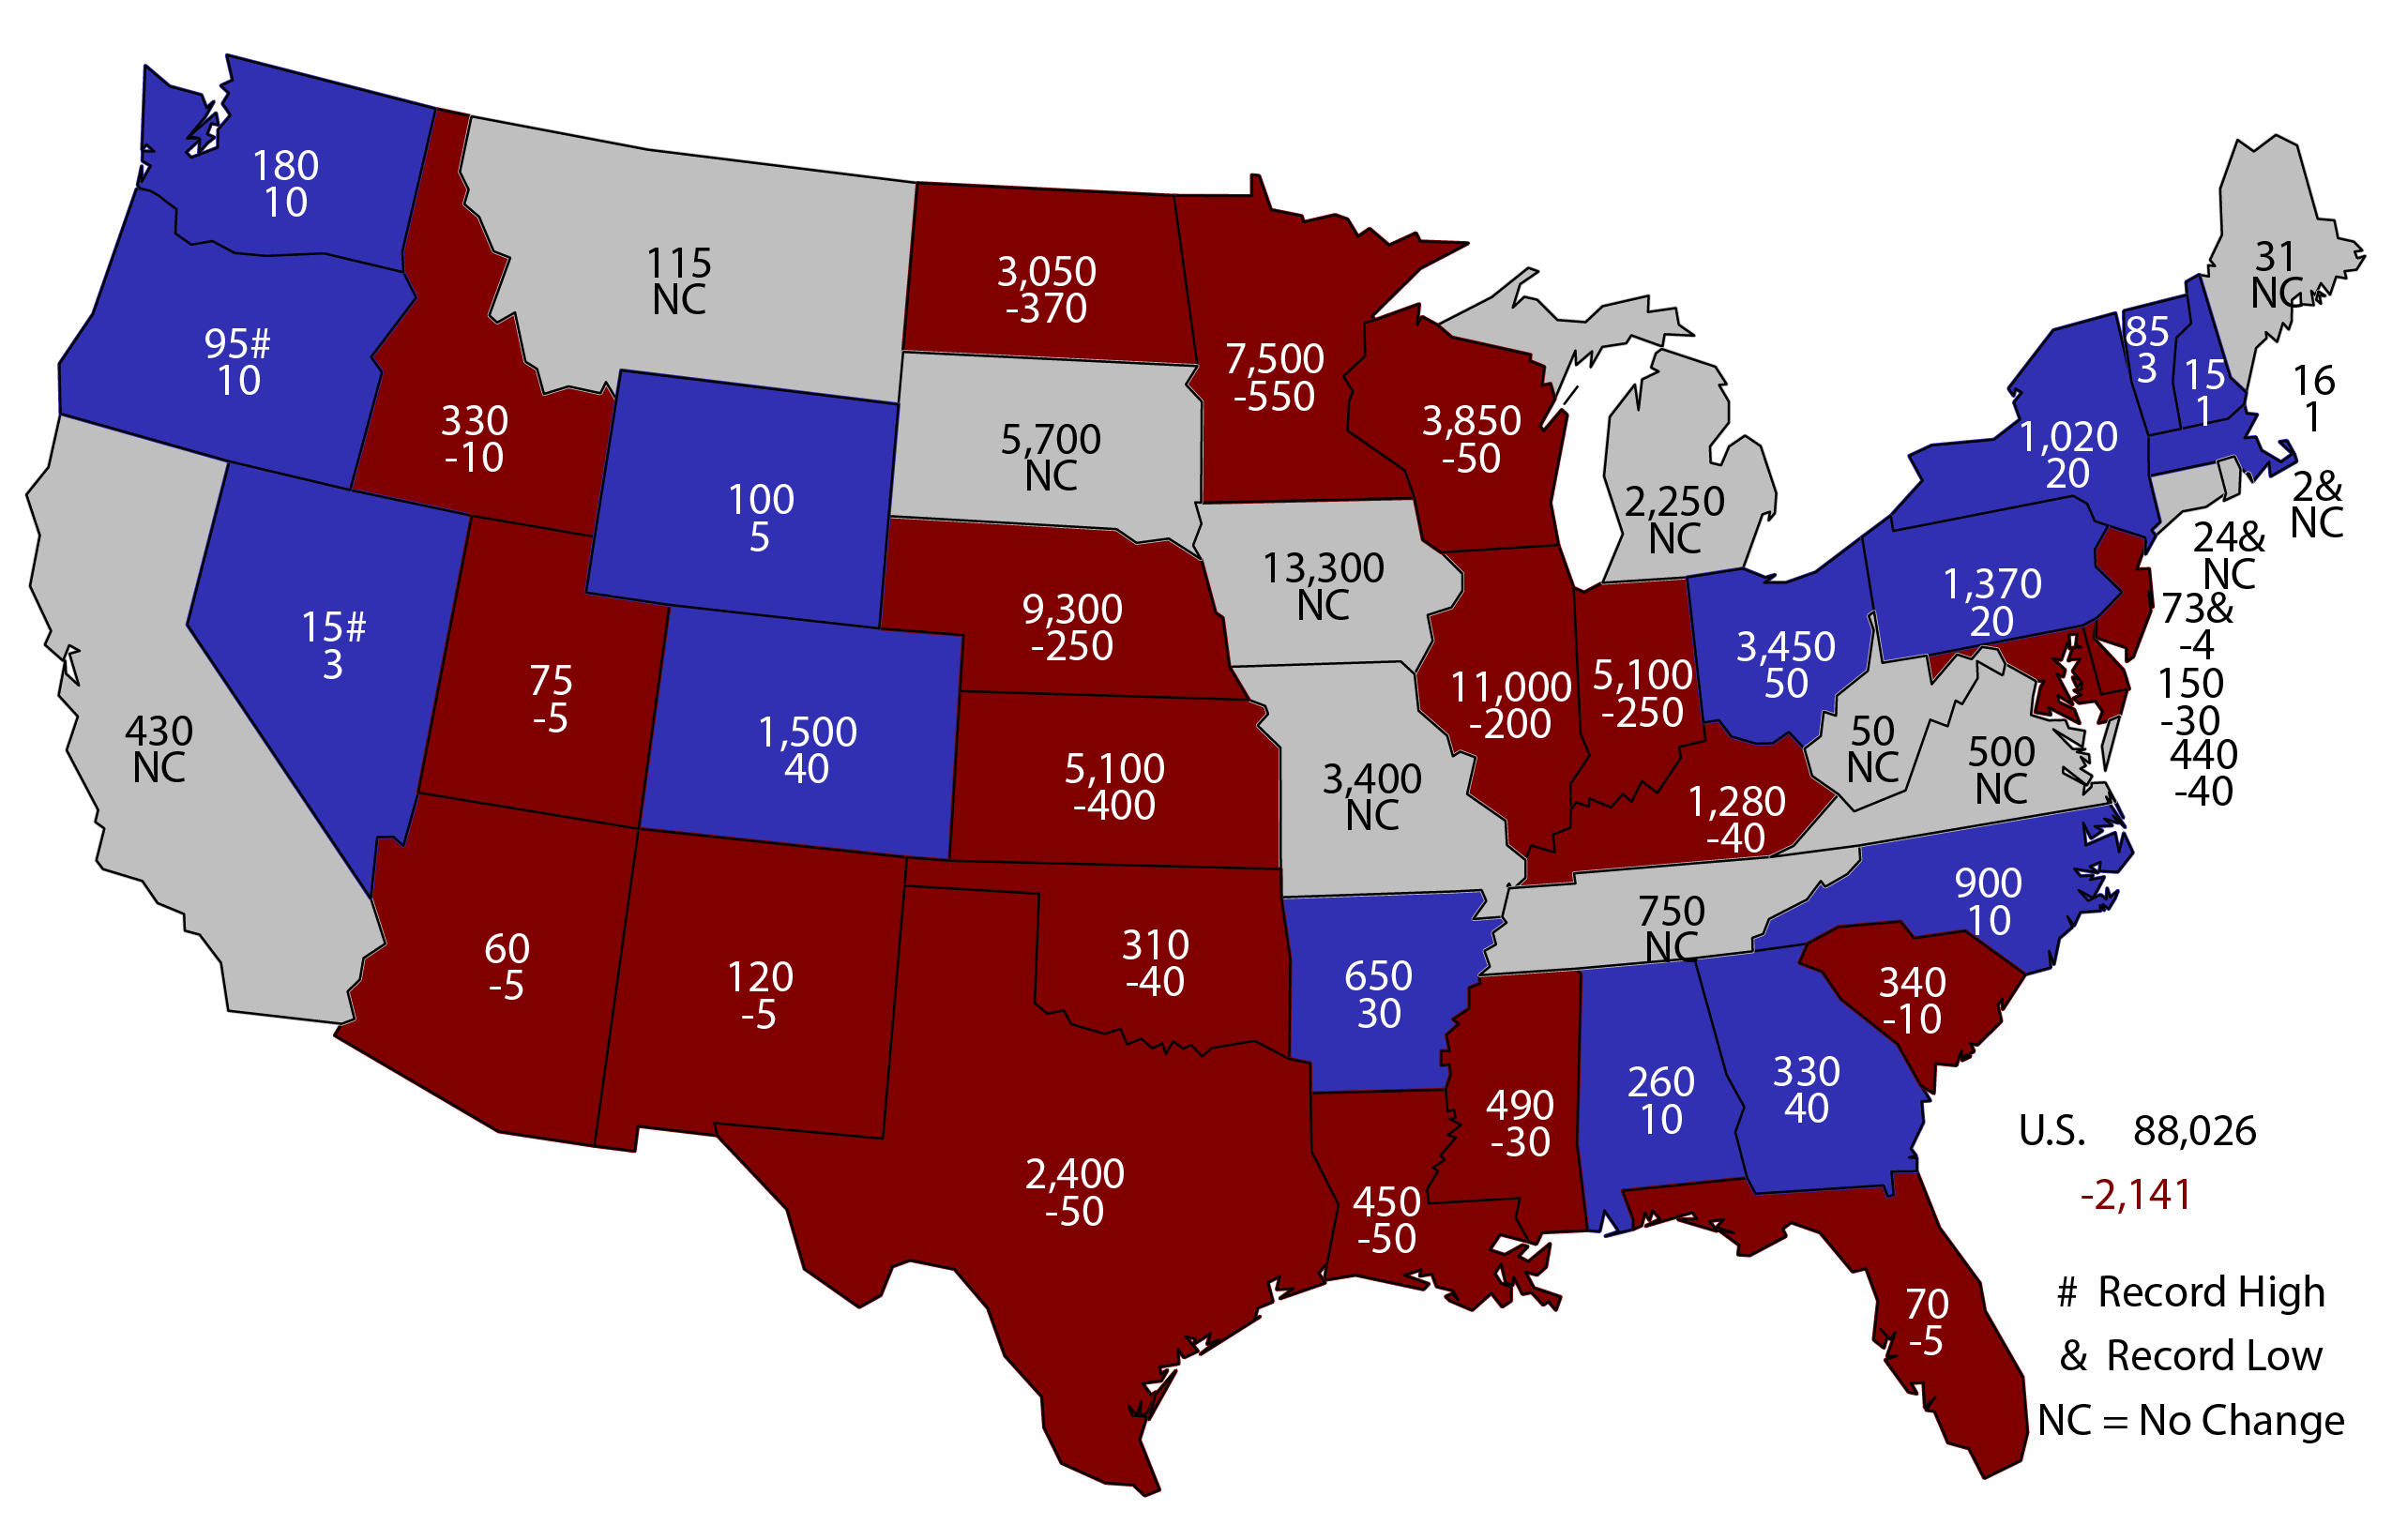
2018 Corn Planted Area
(000) acres and change from 2017
Corn planted area for all purposes in 2018 is expected to total 88.0 million acres, down 2 percent or 2.14 million acres from last year. Iowa leads the country with area to be planted to corn at 13.3 million acres. Compared with 2017, planted acreage is expected to be down or unchanged in 33 of the 48 estimating states.
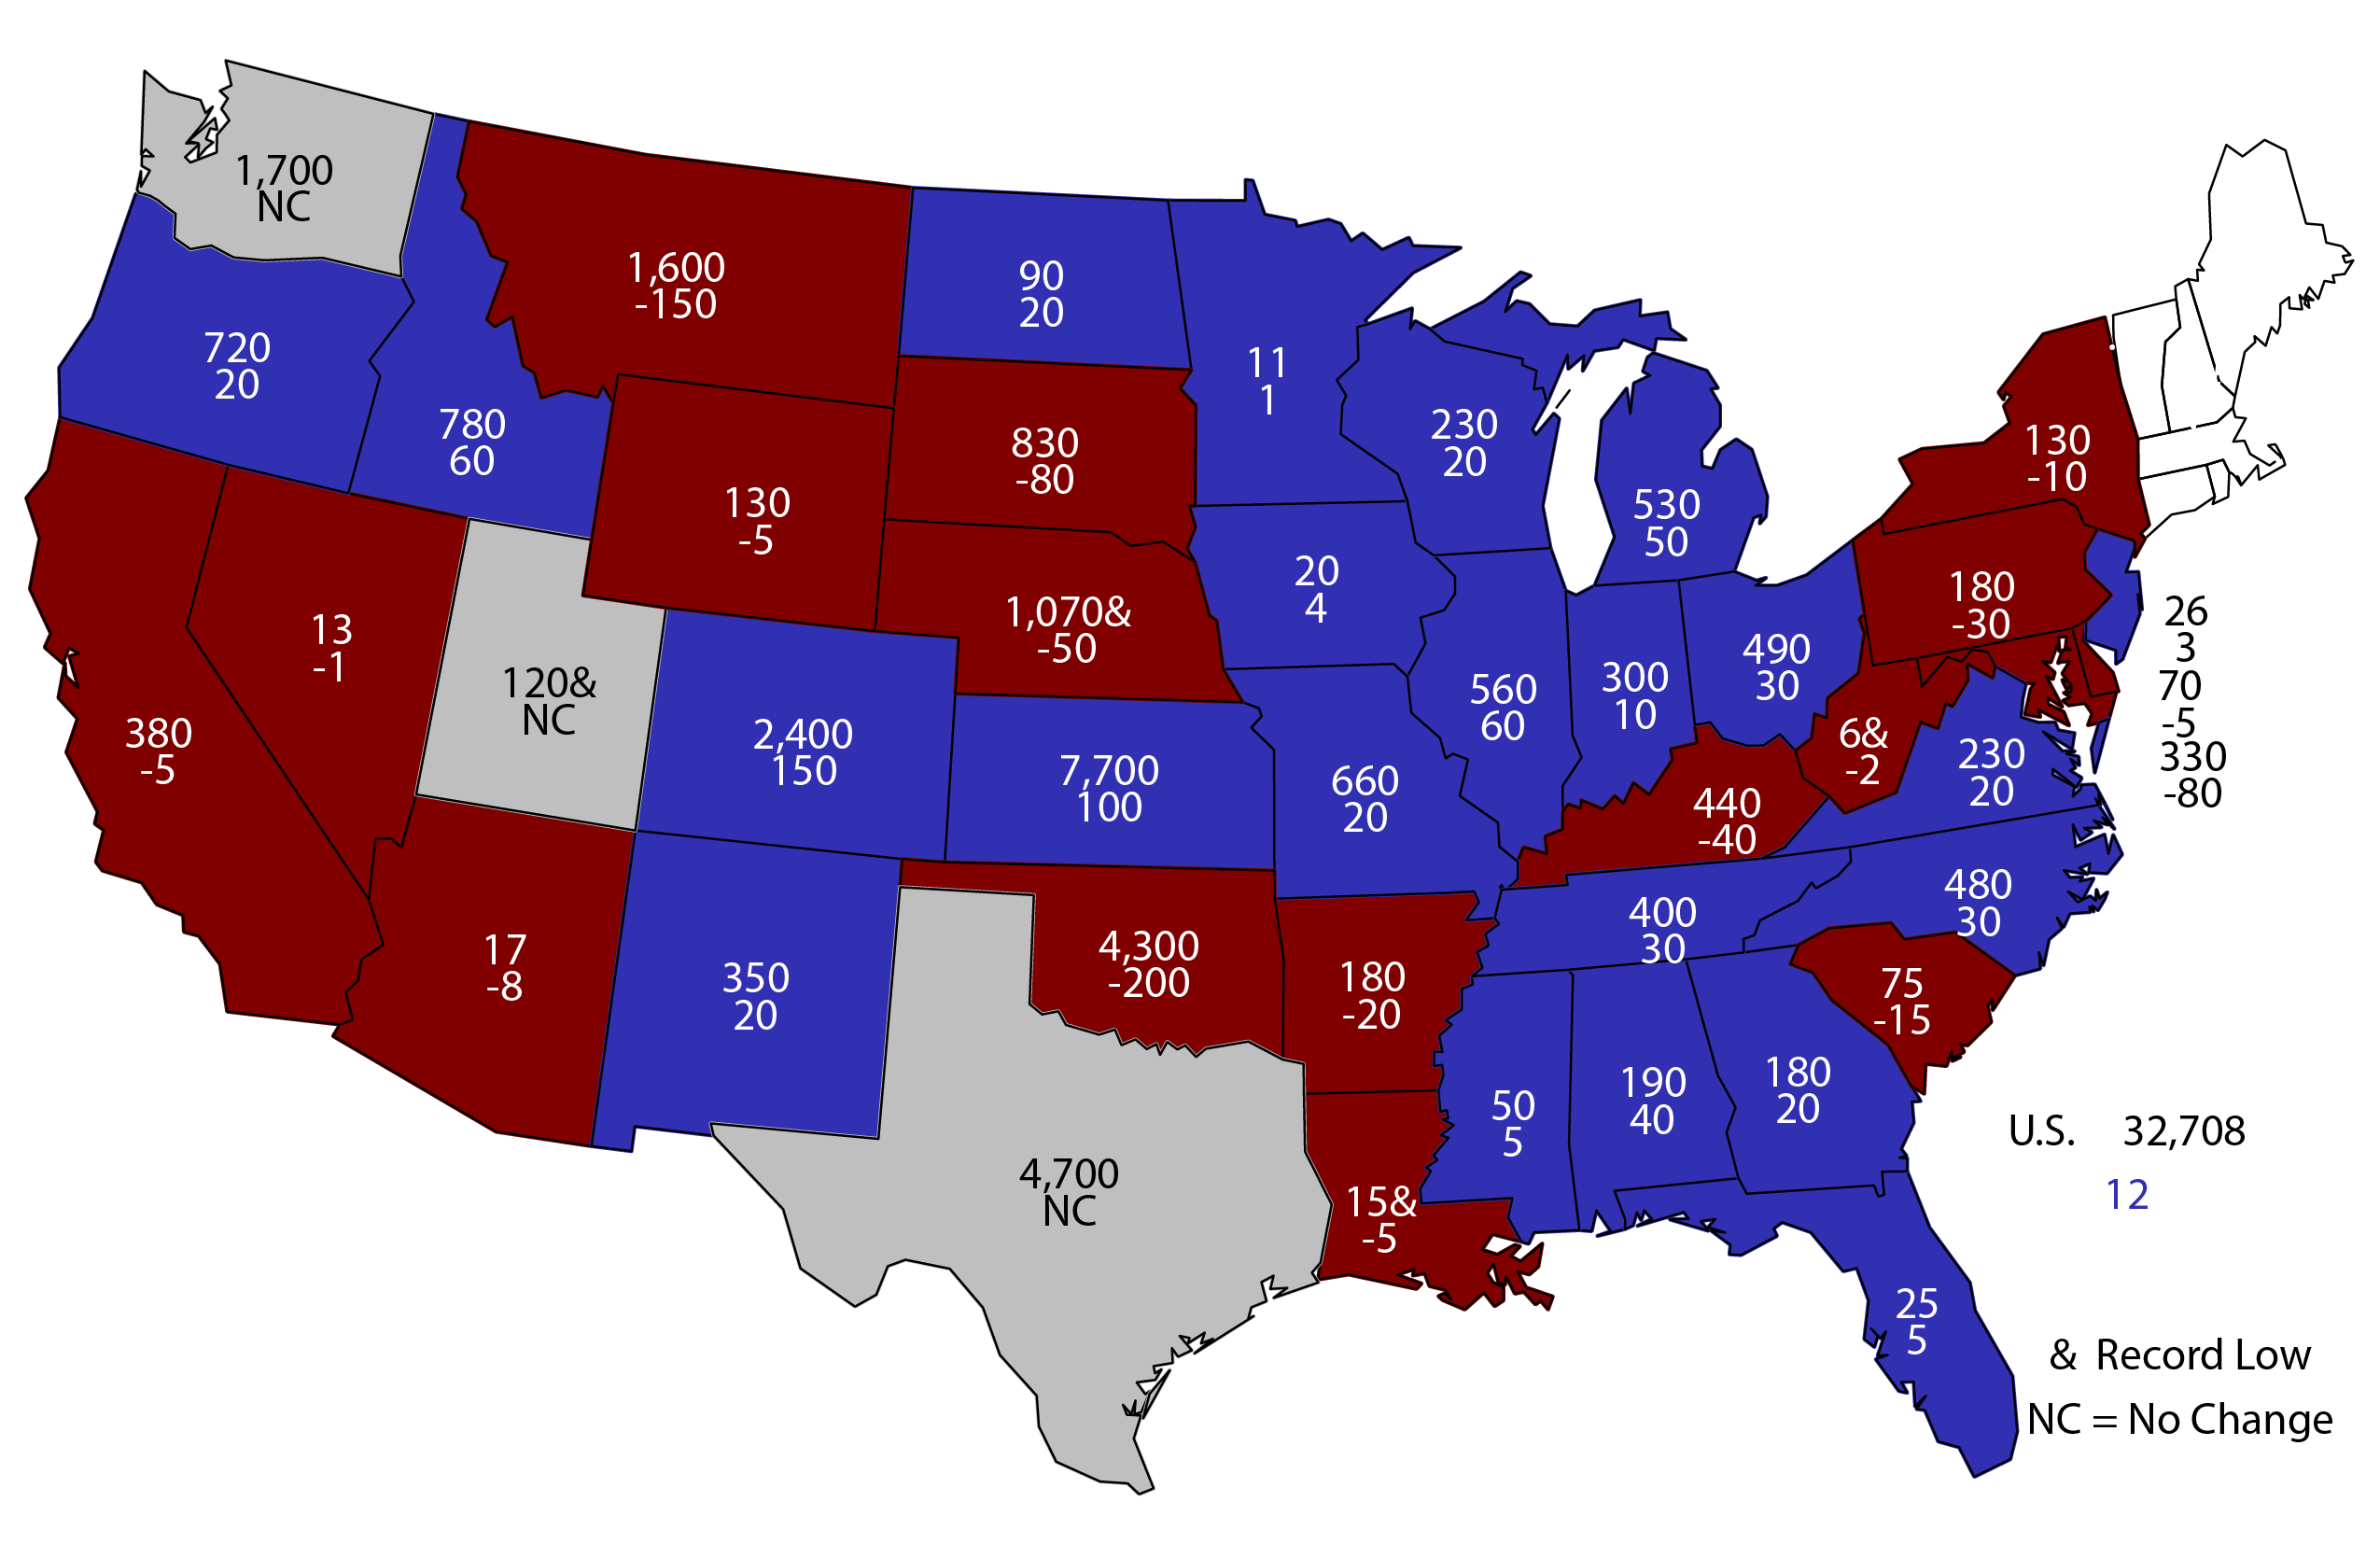
2018 Winter Wheat Planted Area
(000) acres and change from 2017
The 2018 winter wheat planted area, at 32.7 million acres, is up slightly from 2017. Of this total, 23.2 million acres are hard red winter wheat, 5.85 million acres are soft red winter wheat, and 3.64 million acres are white winter wheat.
- Red = acres planted decrease
- Blue = acres planted increase
- Grey = no change in acres planted
- White = not estimated
- Top number = acres planted
- Bottom number = acres planted increase or decrease from 2017
- Red = acres planted decrease
- Blue = acres planted increase
- White = not estimated
- Top number = acres planted
- Bottom number = acres planted increase or decrease from 2017
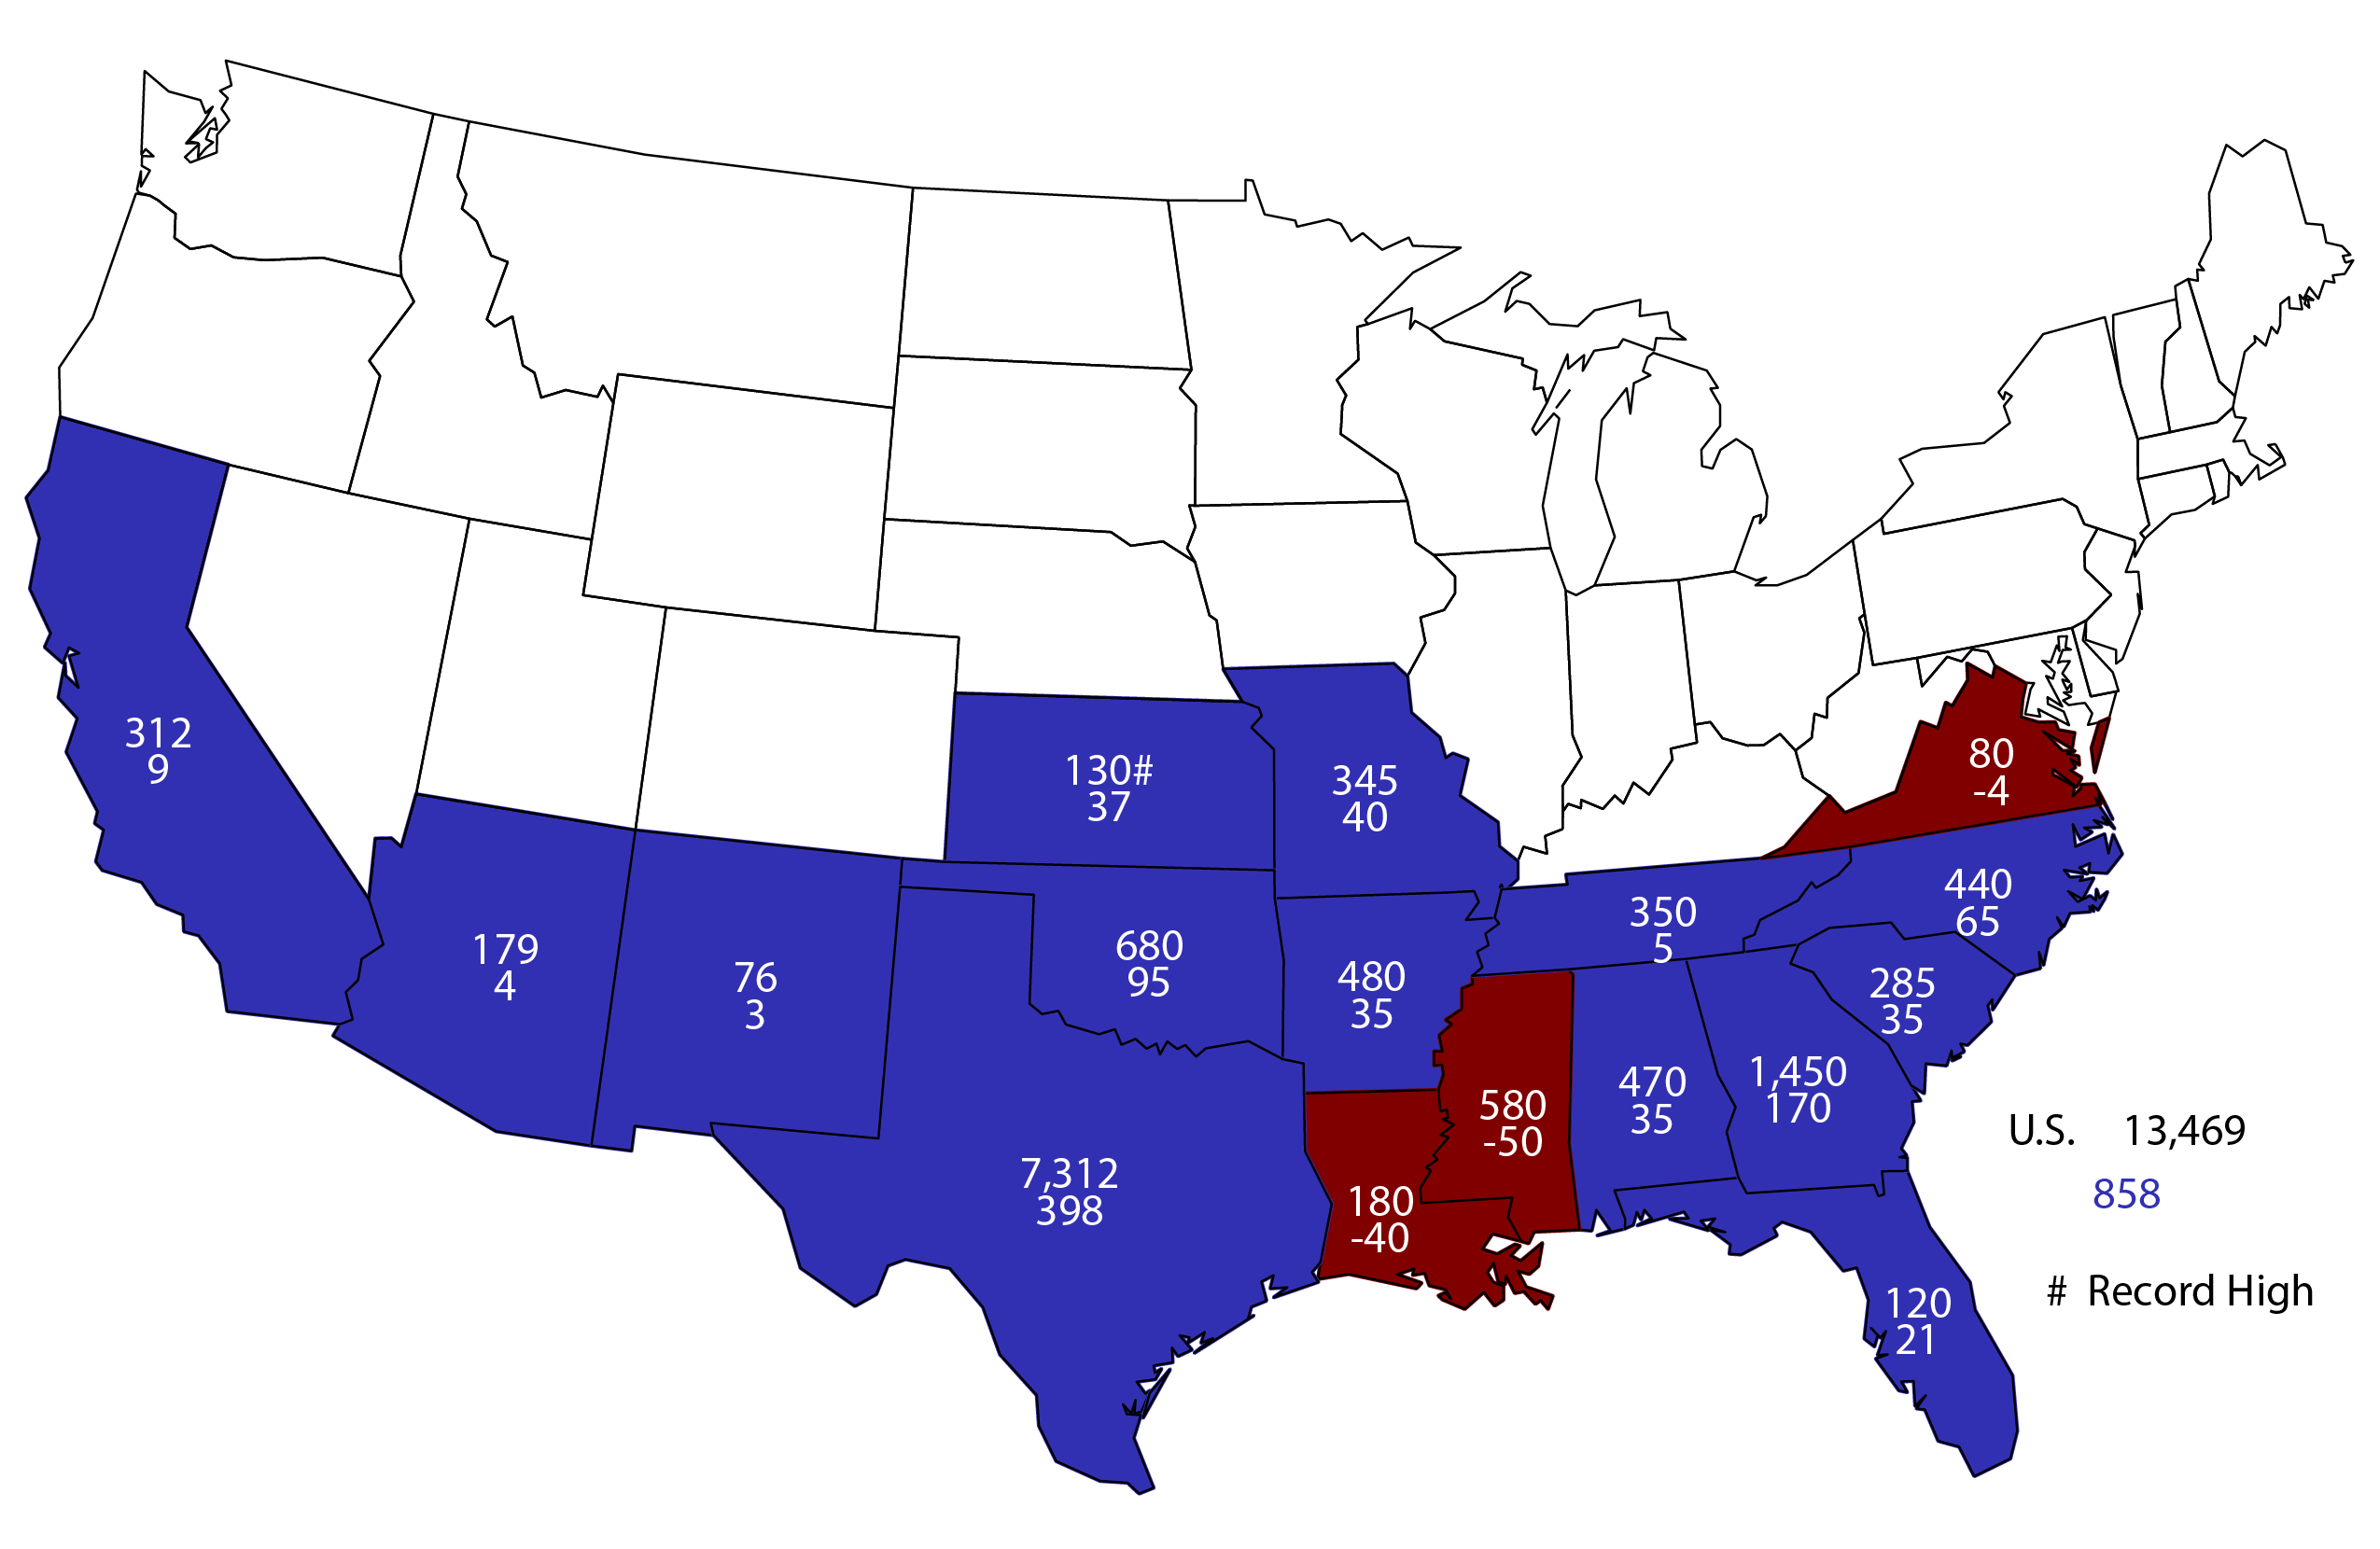
2018 All Cotton Planted Area
acres (000) and change from 2017
All cotton planted area for 2018 is expected to total 13.5 million acres, 7 percent more than in 2017. Upland cotton area is estimated at 13.2 million acres, up 7 percent from 2017. American pima cotton area is estimated at 262,000 acres, up 4 percent.
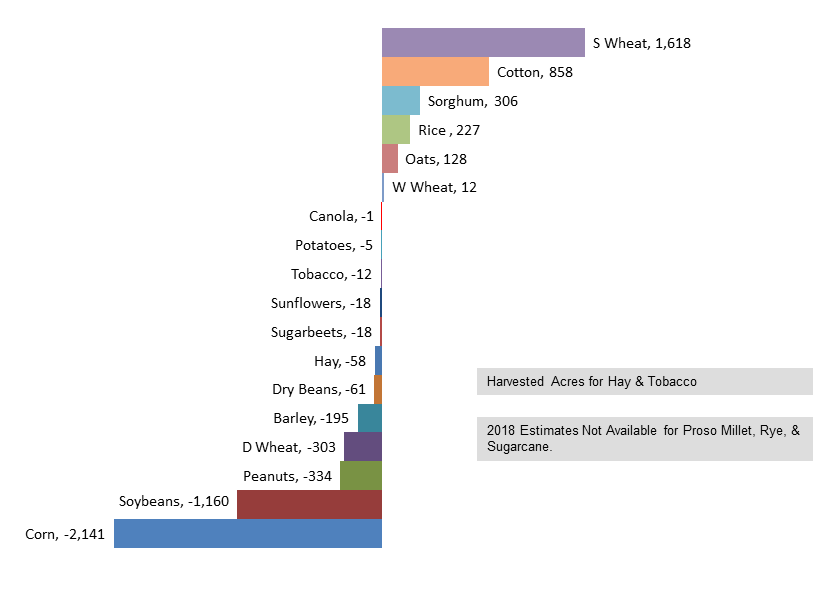
Principal Crop Planted Acres (000)
2018 change from 2017
U.S. producers expect to plant 318 million acres to the 21 principal crops this season, 1.16 million fewer acres than were planted in 2017. Corn acreage is expected to decline the most (down 2.14 million acres) while other spring wheat acreage is expected to show the largest increase, up 1.62 million acres from last season’s actual plantings.
Acreage Intentions vs. Actual Planted Acres
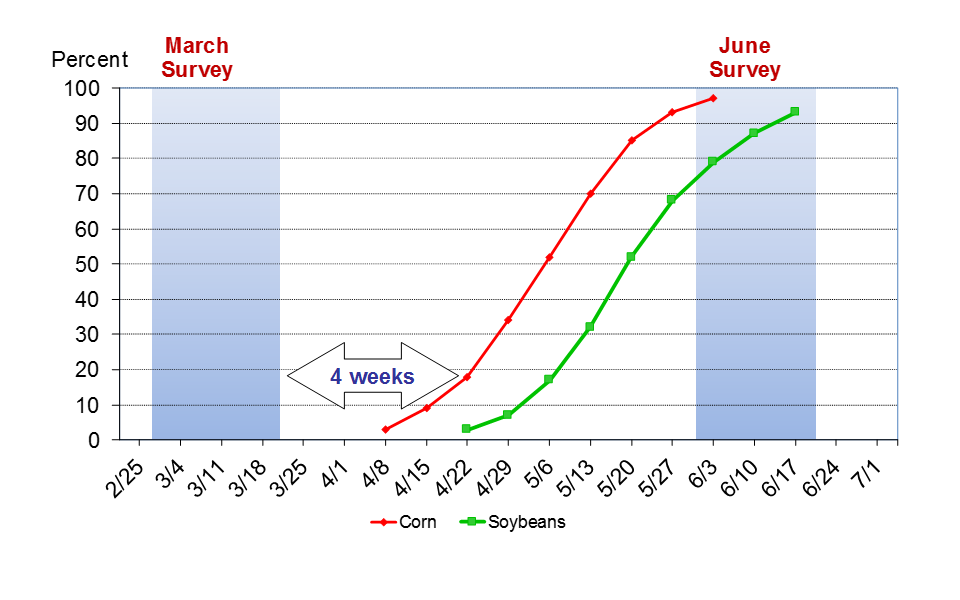
Usual Planting Progress
This graph shows the usual planting progress between the March Agricultural Survey, which is used for the Prospective Plantings report, and the June Agricultural Survey, which is used for the Acreage report. By the time farmers and ranchers have the June Agricultural Survey in hand, they are typically nearly done planting corn and soybeans.
You can explore the full March 29, 2018, Prospective Plantings report. View some of the data on a data visualization available from your desktop, or access all data on the online searchable database Quick Stats.
Last Modified: 11/19/2018