- Data & Statistics
Access Quick Stats (searchable database)
The Quick Stats Database is the most comprehensive tool for accessing agricultural data published by NASS. It allows you to customize your query by commodity, location, or time period.
Access Quick Stats Lite
Quick Stats Lite provides a more structured approach to get commonly requested statistics from our online database.
Explore Statistics
County Level Information
Geospatial Data & Interactive Maps
- Publications
Browse NASS Reports
- by Subject
- by Date (Reports Calendar)
- by Title/Release Day
- by Keyword
- Guide to Products and Services
Additional Reports
Historical Publications
- Archived Ag Census Reports (2002 and prior - published every 5 years)
- Annual Agricultural Statistics
- Statistical Bulletins (final estimates, 1987 to 2012
- Track Records: (crops, livestock, grain stocks)
- Trends 20th century
- Price Reactions (after crop or livestock reports)
Receive Reports by Email:
- Newsroom
News Releases
04/08/25 USDA to Host Data Users’ Meeting on Statistical Programs
03/31/25 US farmers expect to plant more corn and less soybean acres
03/27/25 United States hog inventory down slightly
03/27/25 USDA releases Census of Agriculture data for the U.S. Virgin Islands
02/27/25 USDA releases Census of Agriculture data for the Commonwealth of Northern Mariana Islands
Read More News
ASB Notices
03/19/25 NASS reinstates select data collection programs and reports
02/26/25 NASS Delays Trout Production Data Release
01/02/25 NASS Delays Weekly Slaughter Release
09/25/24 NASS to publish 2023 Irrigation and Water Management report earlier
07/31/24 NASS to Review Acreage Data
Read More Notices
Videos
02/13/24 2022 Census of Agriculture Data Highlights
02/13/24 How to Find 2022 Census of Agriculture Data
02/13/24 2022 Census of Agriculture Data Release Event
07/16/21 What is a Farm?
08/05/20 The NASS Mission: We do it for you
View More Videos
ASB Briefings
04/17/25 National Hemp (April 2025)
04/10/25 Crop Production (April 2025)
03/31/25 Grain Stocks, Prospective Plantings, Rice Stocks (March 2025)
03/27/25 Quarterly Hogs and Pigs (March 2025)
03/11/25 Crop Production (March 2025)
View More Briefings
- Surveys
- Census
- About NASS
Structure and Organization
- Agency Overview
- NASS Biographies
- Organizational Chart
- Assistance to Other Organizations
- International Programs
- Talking About NASS - A guide for partners and stakeholders
- NASS Strategic Plan for FY 2022-2026
- USDA Strategic Goals
Guiding Principles
- Mission and Core Values
- Keeping Data Safe
- Confidentiality Pledge
- Security Pledge
- Security Statement
- Statement of Commitment to Scientific Integrity
- Regulations Guiding NASS
- Information Quality
- Learning Agenda, Fiscal Year 2024 -2026
Civil Rights
Work at NASS
Education and Outreach
- Understanding Ag Statistics
- Data Users' Meetings
- Morris Hansen Lecture
- International Conference on Agricultural Statistics
History and Procedures
- Agricultural Statistics Board and Lockup
- Agricultural Statistics: A Historical Timeline
- The Story of U.S. Agricultural Estimates
- As We Recall: The Growth of Agricultural Estimates, 1933-1961
-
Safeguarding America's Agricultural Statistics Report and Video
- History of Ag Statistics
- Report Procedures
- An Evolving Statistical Service
- Fact Finders for Agriculture
- Hall of Fame
- Contact Us
Mailing Address:
USDA-NASS
1400 Independence Ave., SW
Washington, DC 20250Survey FAQs and Contact Us:
Access FAQs or submit a question.
Data Inquiries:
Hours: 8:00 a.m. - 5:00 p.m. Central Standard Time
Monday - Friday, except federal holidays
Toll-Free: (800) 727-9540Media Inquiries:
Other USDA Inquiries:
Hours: Monday to Friday 8 a.m. - 5 p.m. EST
Toll-Free: (833) One-USDA
Email: askusda@usda.gov
Website: https://ask.usda.gov/s/Translation Services:
Regional and State Field Offices:
Find contact information for Regional and State Field Offices
Ask a Specialist:
Have a specific question for one of our subject experts? Contact a specialist.
Web Content Publishing Schedule:
Section 207(f)(2) of the E-Government Act of 2002 requires federal agencies to develop an inventory of information to be published on their Web sites, establish a schedule for publishing information, make those schedules available for public comment, and post the schedules and priorities on the Web site.
- Help
Technical Issues
Highlights
Farm Economics
May 2014 | ACH12-2 | PDF Version
In 2012, the value of agriculture sales was the highest ever recorded, with both crop and livestock sales at record levels. According to the 2012 Census of Agriculture, farm income was higher than in 2007, but so were production expenses. The increases in income did not benefit all sectors, and production and sales were often concentrated geographically or by farm category or industry. In 2012, crop sales exceeded livestock sales for only the second time in census history (the only other time was in the 1974 agriculture census).
Figure 1.
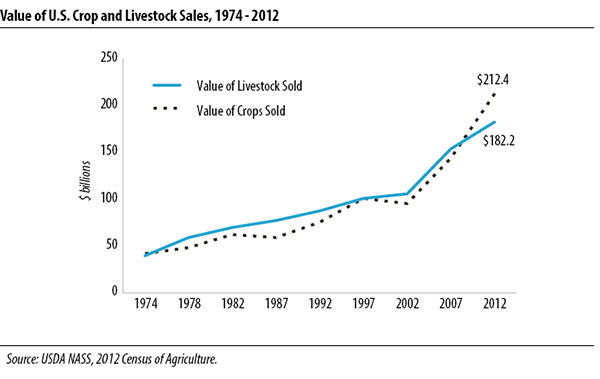
Agriculture Sales
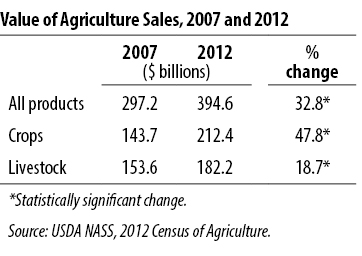
In 2012, U.S. farms sold nearly $395 billion in agricultural products. This was $97 billion, or 33 percent, more than in 2007, at the time of the last agriculture census. Crops accounted for $69 billion of the increase, and livestock accounted for $29 billion. Compared to 2007, crop sales were 48 percent higher and livestock sales were up 19 percent. (Table 1) Crops accounted for 54 percent of agriculture sales in 2012. Five years earlier they accounted for just under half of sales.
Table 1
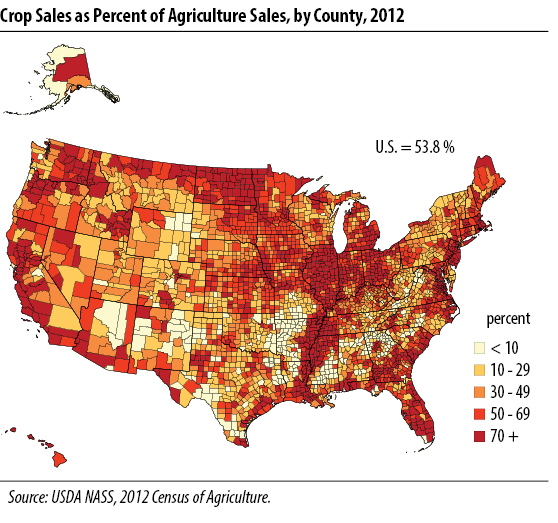
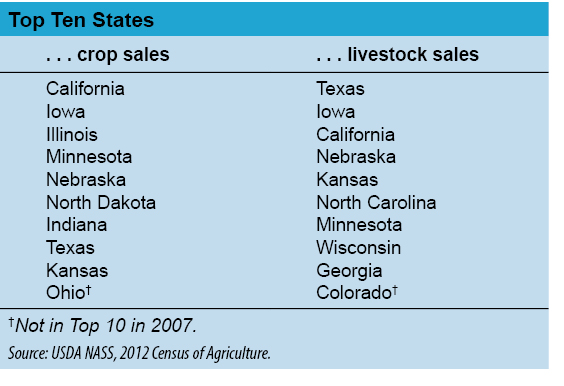
Geographic Concentration
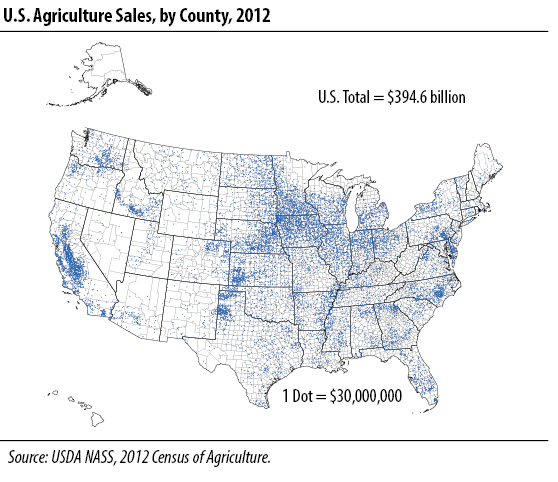
Thirteen states produced more than $10 billion in agricultural products in 2012 and together accounted for 62 percent of agriculture sales (Table 2). Almost every county has at least some agricultural production, but intensity varies across states and counties (Fig. 2). The top ten counties, nine of which are in California, accounted for $29 billion or 7 percent of total agriculture sales. At the top of the list, Fresno County, with $5 billion in agriculture sales, had higher sales than 23 individual states.
Table 2
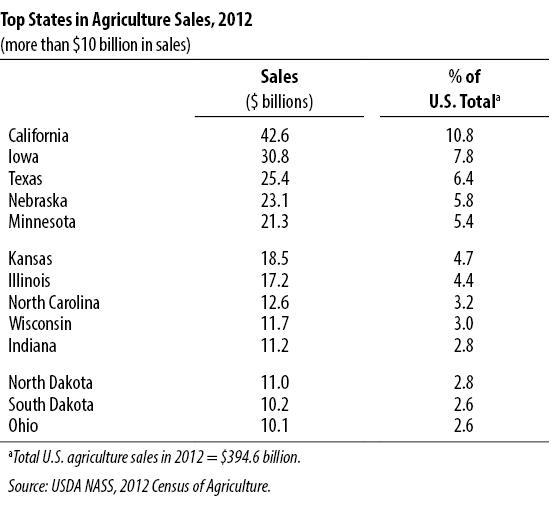
Figure 2
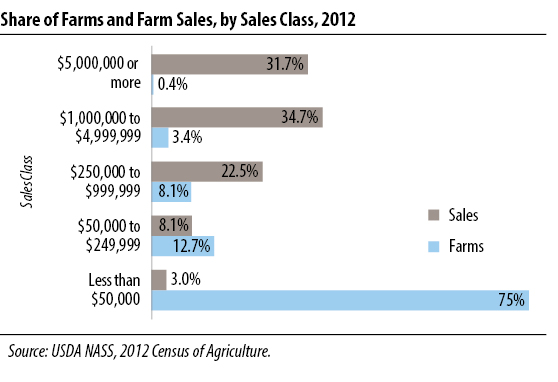
Concentration by Farm Size
Most farms are small, but the value of agricultural production is concentrated on a relatively few large farms. In 2012, 75 percent of all farms had sales of less than $50,000 but together these farms produced only 3 percent of the total value of agricultural products sold. In contrast, less than half of one percent of farms had agriculture sales of more than $5 million, but these few farms produced 32 percent of the total value of all agricultural products sold. Farms with sales of $1 million or more � 4 percent of all farms � produced 66 percent of the total value. (Fig. 3)
The larger farms are not distributed equally across the United States. States in New England and the Southeast have higher proportions of farms with sales under $50,000. In some Midwest states, nearly half of farms had sales of $50,000 or more.
Figure 3
Concentration by Industry
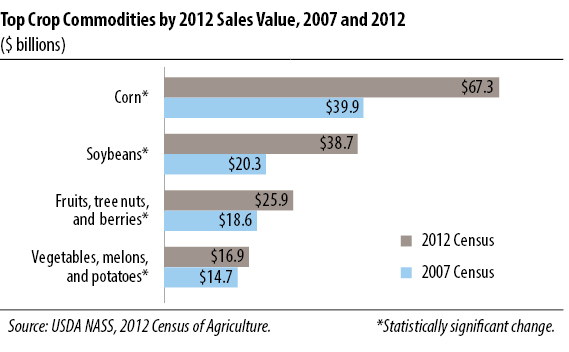
Although both crop and livestock sales increased from 2007 to 2012, not all commodity sectors benefited. Among commodities, the grain and oilseed category had the largest increase (70 percent), but even within this category, crops varied widely, with soybeans increasing 91 percent, corn 69 percent, and wheat 48 percent. Other commodities had much smaller increases, and the value of nursery/ greenhouse products decreased.
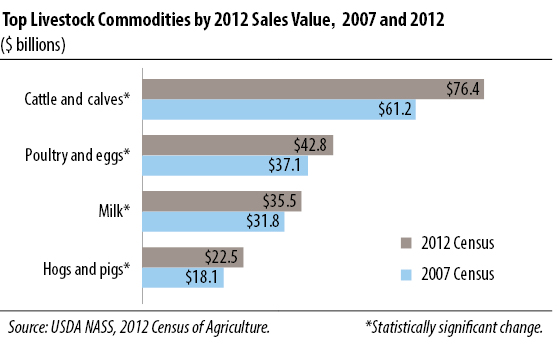
In the livestock sector, sales of cattle and calves (25 percent) and hogs and pigs (25 percent) had the largest percentage increases.
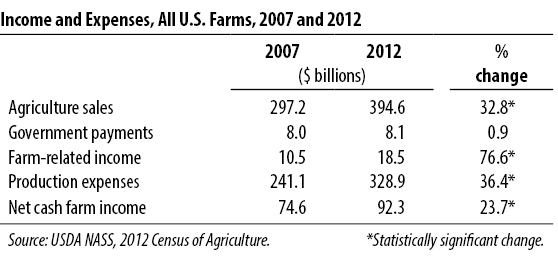
The Balance Sheet: Income and Expenses
In addition to agriculture sales, farm income includes government payments and earnings from a variety of farm-related activities. With these items included, total U.S. farm income in 2012 was $421 billion. However, at $329 billion, farm production expenses were up as well � 36 percent more in 2012 than 2007. As a result, U.S. farm operations had net cash income of $92 billion in 2012; this was 24 percent higher than in 2007. Net cash income is the amount an operation receives from agriculture sales, government payments, and farm-related income after expenses. (Table 3)
Table 3
Government Payments
Government payments to farmers include conservation payments, direct payments, loan deficiency payments, disaster payments, and payments from various other federal programs. The 2012 Census collected data based on programs in effect under the 2008 farm bill.
Of the nation's 2.1 million farmers, 811,387 received a total of $8.1 billion in government payments from federal farm programs. This was 3 percent fewer farms than in 2007 but a 1 percent increase in payments. The largest change came from decreased participation in federal conservation programs. According to the 2012 Census, farmers enrolled 29 percent fewer acres and received 18 percent less in conservation payments in 2012 than 2007.
Farm-related Income
Farm-related income refers to payments received for rent, custom work on other farms, forest product sales, recreational services provided, patronage dividends, crop and livestock insurance payments, and other activities and services closely related to the agricultural operation. For all U.S. farms, this income source increased 76 percent between 2007 and 2012. Crop insurance payments alone increased more than 300 percent from 2007, primarily because of the large area affected by drought in 2012.
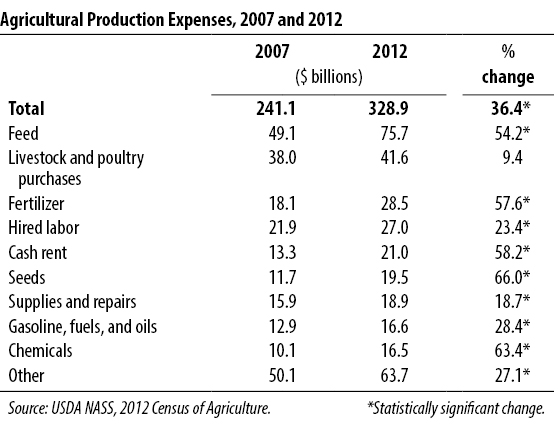
Production Expenses
Between 2007 and 2012, agricultural production costs increased 36 percent. The largest expense categories in 2012 were feed, livestock and poultry purchases, fertilizer, hired labor, and cash rent. The largest percentage increases were in seeds, chemicals, and cash rent. (Table 4)
Table 4
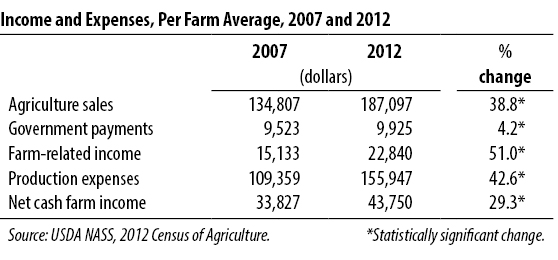
Per Farm Average
At the farm level, the story was similar. Average agriculture sales per farm were 39 percent higher in 2012 than 2007, and farm-related income was up 51 percent. But steep increases in production expenses resulted in average farm increases in net income of 29 percent. Average net cash income per farm was $43,750 in 2012. (Table 5)
Table 5
Snapshot of Crop and Livestock Sales
The top five commodities in 2012 sales were cattle and calves, poultry and eggs, corn, soybeans, and milk. Together, these accounted for $261 billion in sales, or 66 percent of total agriculture sales.
About the Census of Agriculture
The Census of Agriculture is the leading source of facts and figures about American agriculture. The 2012 Census results provide information at national, state, and county levels about what agricultural products were raised in the United States in 2012, as well as where, how, and by whom.
To learn more about statistical significance and Census methodology, see frequently asked questions.
For easy-to-use tools that help both professional and casual users find and use the data, go to www.nass.usda.gov/AgCensus/.
Last Modified: 09/10/2018